
FPA Conference
Submitted by Trott Brook Financial on June 18th, 2018I recently spent several days in Los Angeles visiting an asset manager that I hold in high regard, First Pacific Advisors (FPA). The event was a biannual opportunity to hear from each of the firm’s portfolio strategists, ask questions and meet their respective teams.
A lot of ground was covered, but I wanted to share a few things I found interesting. Let’s start with some statistics about the current market environment.
Following the 2016 presidential election, the S&P500 set a record for consecutive months of positive returns at 15. By comparison, the second longest streak was only 10! The most recent record jumps out as an anomaly if you look back at market history:
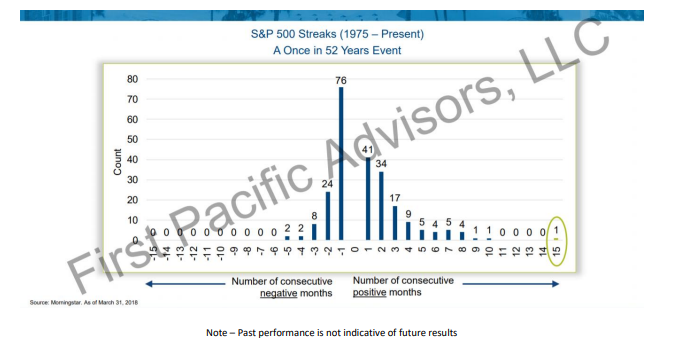
Sticking with market history, another interesting fact is the current bull market is the second longest since 1926. As of the end of April, the current market rally has persisted for 109 months according to JP Morgan. The longest bull market on record lasted for 113 months (October 1990 – March 2000). The average length of a bull market since 1926 has only been about 55 months.
These statistics, though interesting, offer no real predictive value. What’s important is they provide historical perspective and help to set expectations.
The 15 month period of consecutively rising stock prices beginning in late 2016 was anything but normal. I can’t stress this enough. Volatility jolted investors back to reality beginning early this year. But again, historically speaking, volatility is the norm so it would be wise to expect more to come.
Future Returns
Something else was pointed out during one presentation that caught my attention: the components of return of the S&P500 dating back to 1982. If you don’t know anything about investing or finance, this could be a bit technical so I’ll try to simplify as much as possible.
When you invest in a productive asset such as a rental property or business, there are several factors that determine your return. The three basic components are earnings growth, cash dividends and multiple expansion. The sum of these components equates your return.
The third component of the three is the one least understood but it’s the most important for the purposes of our discussion. Isolating this variable may be the best way to explain it.
Imagine you purchase a business today that earns $1 million per year. You pay an earnings multiple of 10 to purchase the business. Therefore, your purchase price is $10 million ($1 million of net profits multiplied by 10).
Now, assume the economics of the business are mediocre to poor and that you hold for the next five years. Because it isn’t a great business, you have to reinvest all of your profits just to keep things going. In other words, five years from today, you’ve had no earnings growth and have not taken any cash dividends. In essence, the business characteristics are the same as the day you purchased it.
The question is, how can you turn this into a profitable investment?
Remember the three components of return: earnings growth, dividends and multiple expansion. In our example, there has been no earnings growth or dividends. If you sold the business for the same multiple you bought at (10 times profit), you’d simply break even on your investment. The only way to profit from this investment is to sell at a higher multiple than you paid. Perhaps you could find someone who is more optimistic about the future of the company and they would be willing to pay 12 times current profits.
This would be an example of multiple expansion. It occurs when the marketplace is willing to pay more for an asset, all things equal.
Since 1982, the return components of the S&P500 are as follows:1
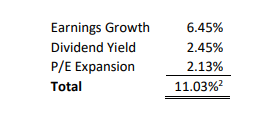
The component to focus on is P/E (multiple) expansion. What’s actually more important is the force that has driven P/E expansion: falling interest rates. Interest rates peaked in 1982 and have basically gone down ever since. Government bonds went from yielding roughly 15% to less than 2% in recent years (although rates have crept up to the 3% range recently).
Ultimately the point FPA was making in their presentation is declining interest rates over the past 35 years have provided a tremendous tailwind for investors. But if interest rates rise over an extended period, it’s very likely that P/E (multiple) expansion will flip to P/E (multiple) contraction. This would certainly create a more challenging environment for investors, most of whom lack much experience or memory of investing prior to 1980.
Concluding Thoughts
As always, there are all kinds of interesting statistics and things to worry about in financial markets. Although many of these issues are interesting to think and talk about, they often don’t provide a good basis for taking any direct action. For example, the stock market was historically calm for a record period after the 2016 presidential election. Though thought-provoking, there really isn’t anything to do with this information.
However, an investor’s worst enemy is virtually always him/herself. Study after study has demonstrated how investors routinely get killed because they become too fearful or greedy. One major cause of this, in my view, is the lack of historical knowledge that most investors possess. As the old adage goes, “Those who don’t know the mistakes of history are doomed to repeat them.” In that light, I think its helpful to point out what has occurred in the past. Although it doesn’t tell us what will happen, it certainly demonstrates what can happen. This basis of knowledge hopefully creates a better set of expectations for investors which ideally would lead to better decisions. First Pacific Advisors (FPA) shares this conviction which is one of many reasons I have great admiration for their firm.
1 Source: Bloomberg.
2 Past Performance is not indicative of future results
Disclosure
Advisory services offered through Trott Brook Financial, LLC, a registered investment advisor. Securities offered through LaSalle Street Securities, LLC, a FINRA/SIPC member broker/dealer. Trott Brook Financial, LLC and LaSalle Street Securities, LLC are unaffiliated separate legal entities.
Views and opinions are subject to change at any time based on market and other conditions.
The information provided does not constitute investment advice and it should not be relied on as such. It does not take into account any investor's particular investment objectives, strategies, tax status or investment horizon. You should consult your tax and financial advisor. All material has been obtained from sources believed to be reliable. There is no representation or warranty as to the accuracy of the information and Trott Brook Financial shall have no liability for decisions based on such information. Index returns are unmanaged and do not reflect the deduction of any fees or expenses.
Index returns reflect all items of income, gain and loss and the reinvestment of dividends and other income.